The NPS formula
Every NPS response is a whole number from 0 to 10, answering 'How likely are you to recommend us to a friend or colleague?'. To turn a pile of answers into a score, sort each one into a bucket: 9 or 10 is a promoter, 7 or 8 is a passive, and 0 through 6 is a detractor.
Then: NPS = (promoters ÷ total responses × 100) − (detractors ÷ total responses × 100). The total includes passives. Passives don't appear on either side of the minus sign, but they sit in the denominator and dilute both percentages — that's by design.
The result ranges from −100 (everyone is a detractor) to +100 (everyone is a promoter). Zero means promoters and detractors are equal in number — not that customers are neutral. Round to a whole number; decimals suggest a precision the method doesn't have.
Calculating it step by step
- 1
Count the valid responses
Include every 0–10 answer for the period. Remove blanks and duplicates, but never remove anyone because their score is inconvenient. This number is your denominator.
- 2
Work out the promoter percentage
Count every 9 and 10. Divide by the total and multiply by 100.
- 3
Work out the detractor percentage
Count every 0 through 6. Divide by the same total — passives included — and multiply by 100.
- 4
Subtract
Promoter percentage minus detractor percentage. That's your NPS. Passives are already accounted for because they're in the total.
- 5
Write the sample size next to the score
'+35 (n = 200)' tells a reader how much weight the number can carry. '+35' on its own doesn't.
Three worked examples
Example 1 — a typical period. 200 responses: 110 promoters, 50 passives, 40 detractors. Promoters: 110 ÷ 200 = 55%. Detractors: 40 ÷ 200 = 20%. NPS = 55 − 20 = +35.
Example 2 — a negative score. 40 responses: 12 promoters, 14 passives, 14 detractors. Promoters: 12 ÷ 40 = 30%. Detractors: 14 ÷ 40 = 35%. NPS = 30 − 35 = −5. A negative score means there are more detractors than promoters. It doesn't mean most customers are unhappy — here 65% scored 7 or higher.
Example 3 — combining two locations. Location A: 80 responses, 44 promoters, 20 passives, 16 detractors, so 55% − 20% = +35. Location B: 60 responses, 21 promoters, 15 passives, 24 detractors, so 35% − 40% = −5. Combined: 140 responses, 65 promoters, 40 detractors, so 46.4% − 28.6% = +18 (rounded). Averaging the two location scores gives +15, which is wrong because the locations have different numbers of responses. Always recompute from the raw counts.
Common calculation mistakes
- Averaging the scores. A mean of 8 out of 10 tells you nothing about NPS. Ten customers who all score 8 give an NPS of 0 — they're all passives. Five who score 9 and five who score 7 also average 8, and give +50. NPS is about how many people sit at each end, not the middle.
- Dropping passives from the denominator. Take example 1 without the passives: 110 ÷ 150 = 73.3% and 40 ÷ 150 = 26.7%, giving +47 instead of +35. The score looks better and is wrong.
- Trusting tiny samples. With 20 responses, each person is 5% of the total, so one customer moving from promoter to detractor drops the score by 10 points. With 200 responses, the same change moves it by 1 point. Publish n next to the score and don't react to swings that two or three people can cause.
- Adding a percentage sign. NPS is the difference between two percentages, so it's reported as a plain number: +35, not 35%. '35%' gets misread as '35% of customers are promoters'.
- Using a different scale. A 1–5 or 1–10 scale isn't NPS. The buckets only work on 0–10 with both ends included.
- Filtering the audience. Asking only after successful orders, or leaving out customers with open complaints, produces a score for a subset of customers — and it'll look better than the real one.
How to read the score over time and by segment
A single NPS figure means little on its own. Benchmarks vary widely by industry, region, customer type, and how the question was sent, so comparing your score with a published one mostly measures differences in method. The comparison that holds up is your own score against your own past, collected the same way.
Calculate it per period — monthly or quarterly, depending on how many responses you get — and look at the direction across several periods rather than the change between two. Track the promoter and detractor percentages as separate lines too. A flat NPS can hide both rising at once, which means customers are getting more polarised, not more stable.
Segment by anything you can act on: location, plan, product line, customer tenure, support channel. Calculate each segment from its own counts, and only report segments with enough responses that one or two people can't swing them. When the overall score moves, the segment breakdown usually shows where the move came from.
Read the comments alongside the number. The score tells you how many customers are at risk; the answers to 'why did you give that score?' tell you what to fix.
The fastest way to collect NPS responses
The calculation is only as good as the responses behind it, and response counts depend on effort. A 0–10 question that opens in one tap, with no login and no multi-page form, gets more answers than the same question buried at the end of a long survey.
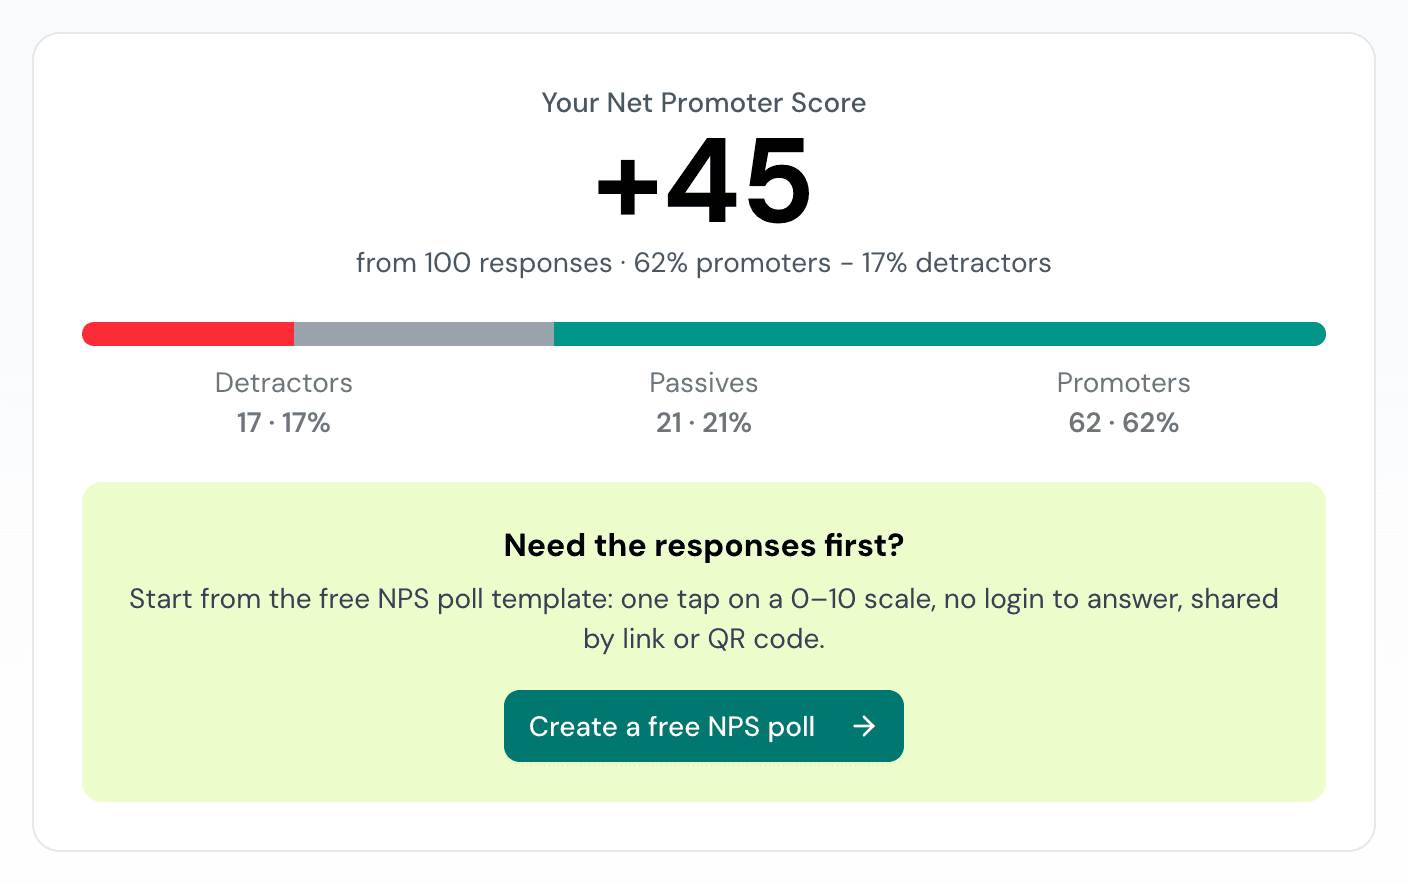
On Onetapvote, the NPS template is a single 0–10 question you can share as a link, in an email, or as a QR code. Respondents tap a number and they're done — under 30 seconds, no account, no app. Results show how many people picked each number, so you can count promoters, passives, and detractors directly, or enter the counts in the free NPS calculator on Onetapvote to get the score.
This guide covers the maths. For the full survey process — who to ask, when to send, and what to do with each group afterwards — see the guide on how to run an NPS survey.